Hoops and Highlights: A Visual Journey Through NBA Stats
Football is my favorite sport. When I was a kid, we’d order pizza every Sunday and gather in the living room to watch the Cowboy game.
And I’ve loved football ever since.
This is not a football project. It’s all about basketball.
When I started digging into this data set diving into the 2021/2022 NBA season stats, I knew very little about basketball. But as a lifelong learner and master Googler, I had no problem finding resources to learn basketball basics.
Once I had a basic understanding of plays, positions, and the main rules of basketball, I was ready to dig into the data.
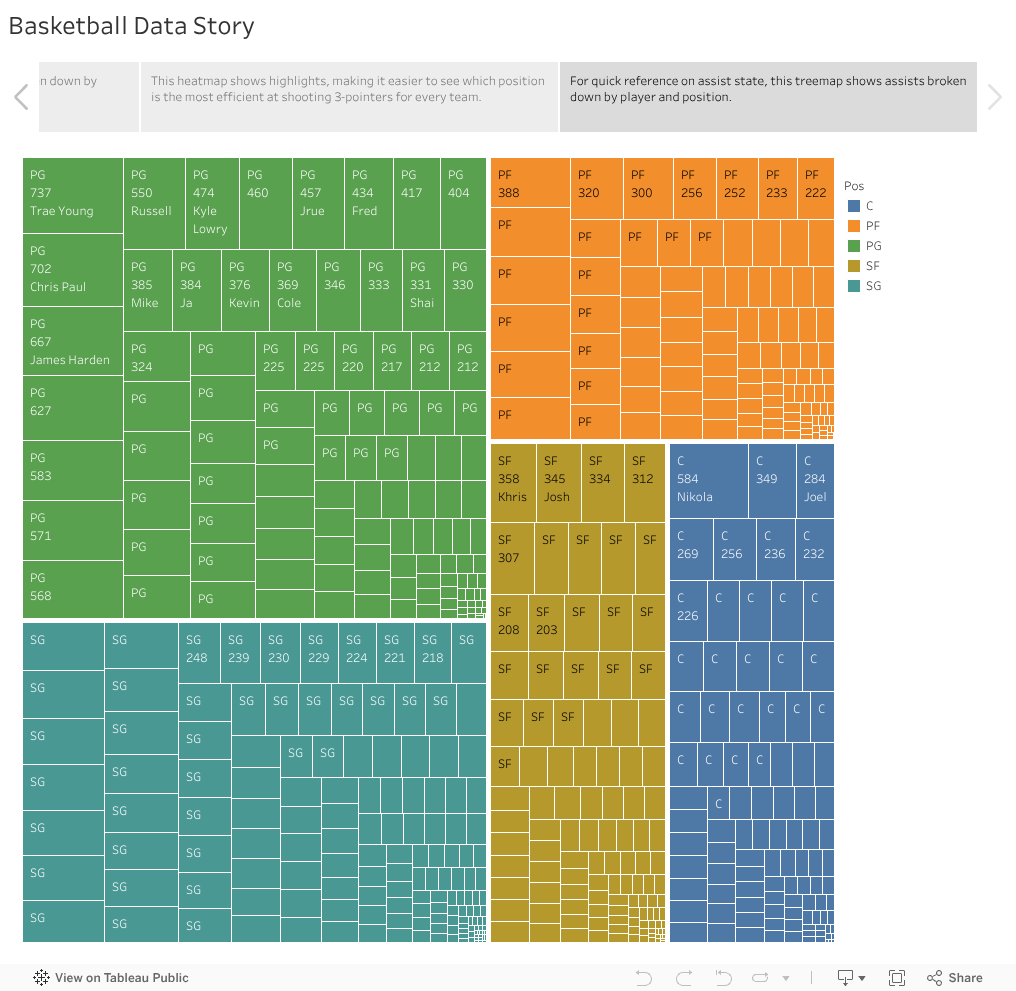
I opted to analyze and visualize this data in Tableau. I’d created a dashboard, but for this project I wanted to familiarize myself with Tableau Stories.
You can view my story below. Just click the arrows to navigate from page to page. You can also click the link to view this project on Tableau Public.
Hi, I’m Kathy, Data Nerd
I am actively seeking opportunities in data analytics. With experience in both Marketing and Education, I love uncovering customer insights and am continually evolving as a data analyst!
If you’d like to chat or have an opportunity I might be a fit for, let’s connect! You can reach me on LinkedIn.